The Logs screen
Open Logs from the left sidebar. You’ll see a reverse-chronological table of every tool call across your gateways, with these columns:- Session ID — the proxy session the call belongs to (e.g., proxy-20b3c2e6-e24b-4183-…)
- Timestamp — when the call was made
- Server Name / Entity Name — the MCP server logo (Hubspot, Notion, Linear, etc.) and the tool that was invoked (e.g., HUBSPOT_LIST_CONTACTS, get_me, search)
- Method — the MCP method used (e.g., tools/call)
- Gateway Name — which Gateway Config the instance belongs to (e.g., “Daily work”, “Notion”)
- Instance Name — the specific instance that handled the call
- Client Name — the MCP client that connected (e.g., demo-agent, Claude Desktop, Cursor)
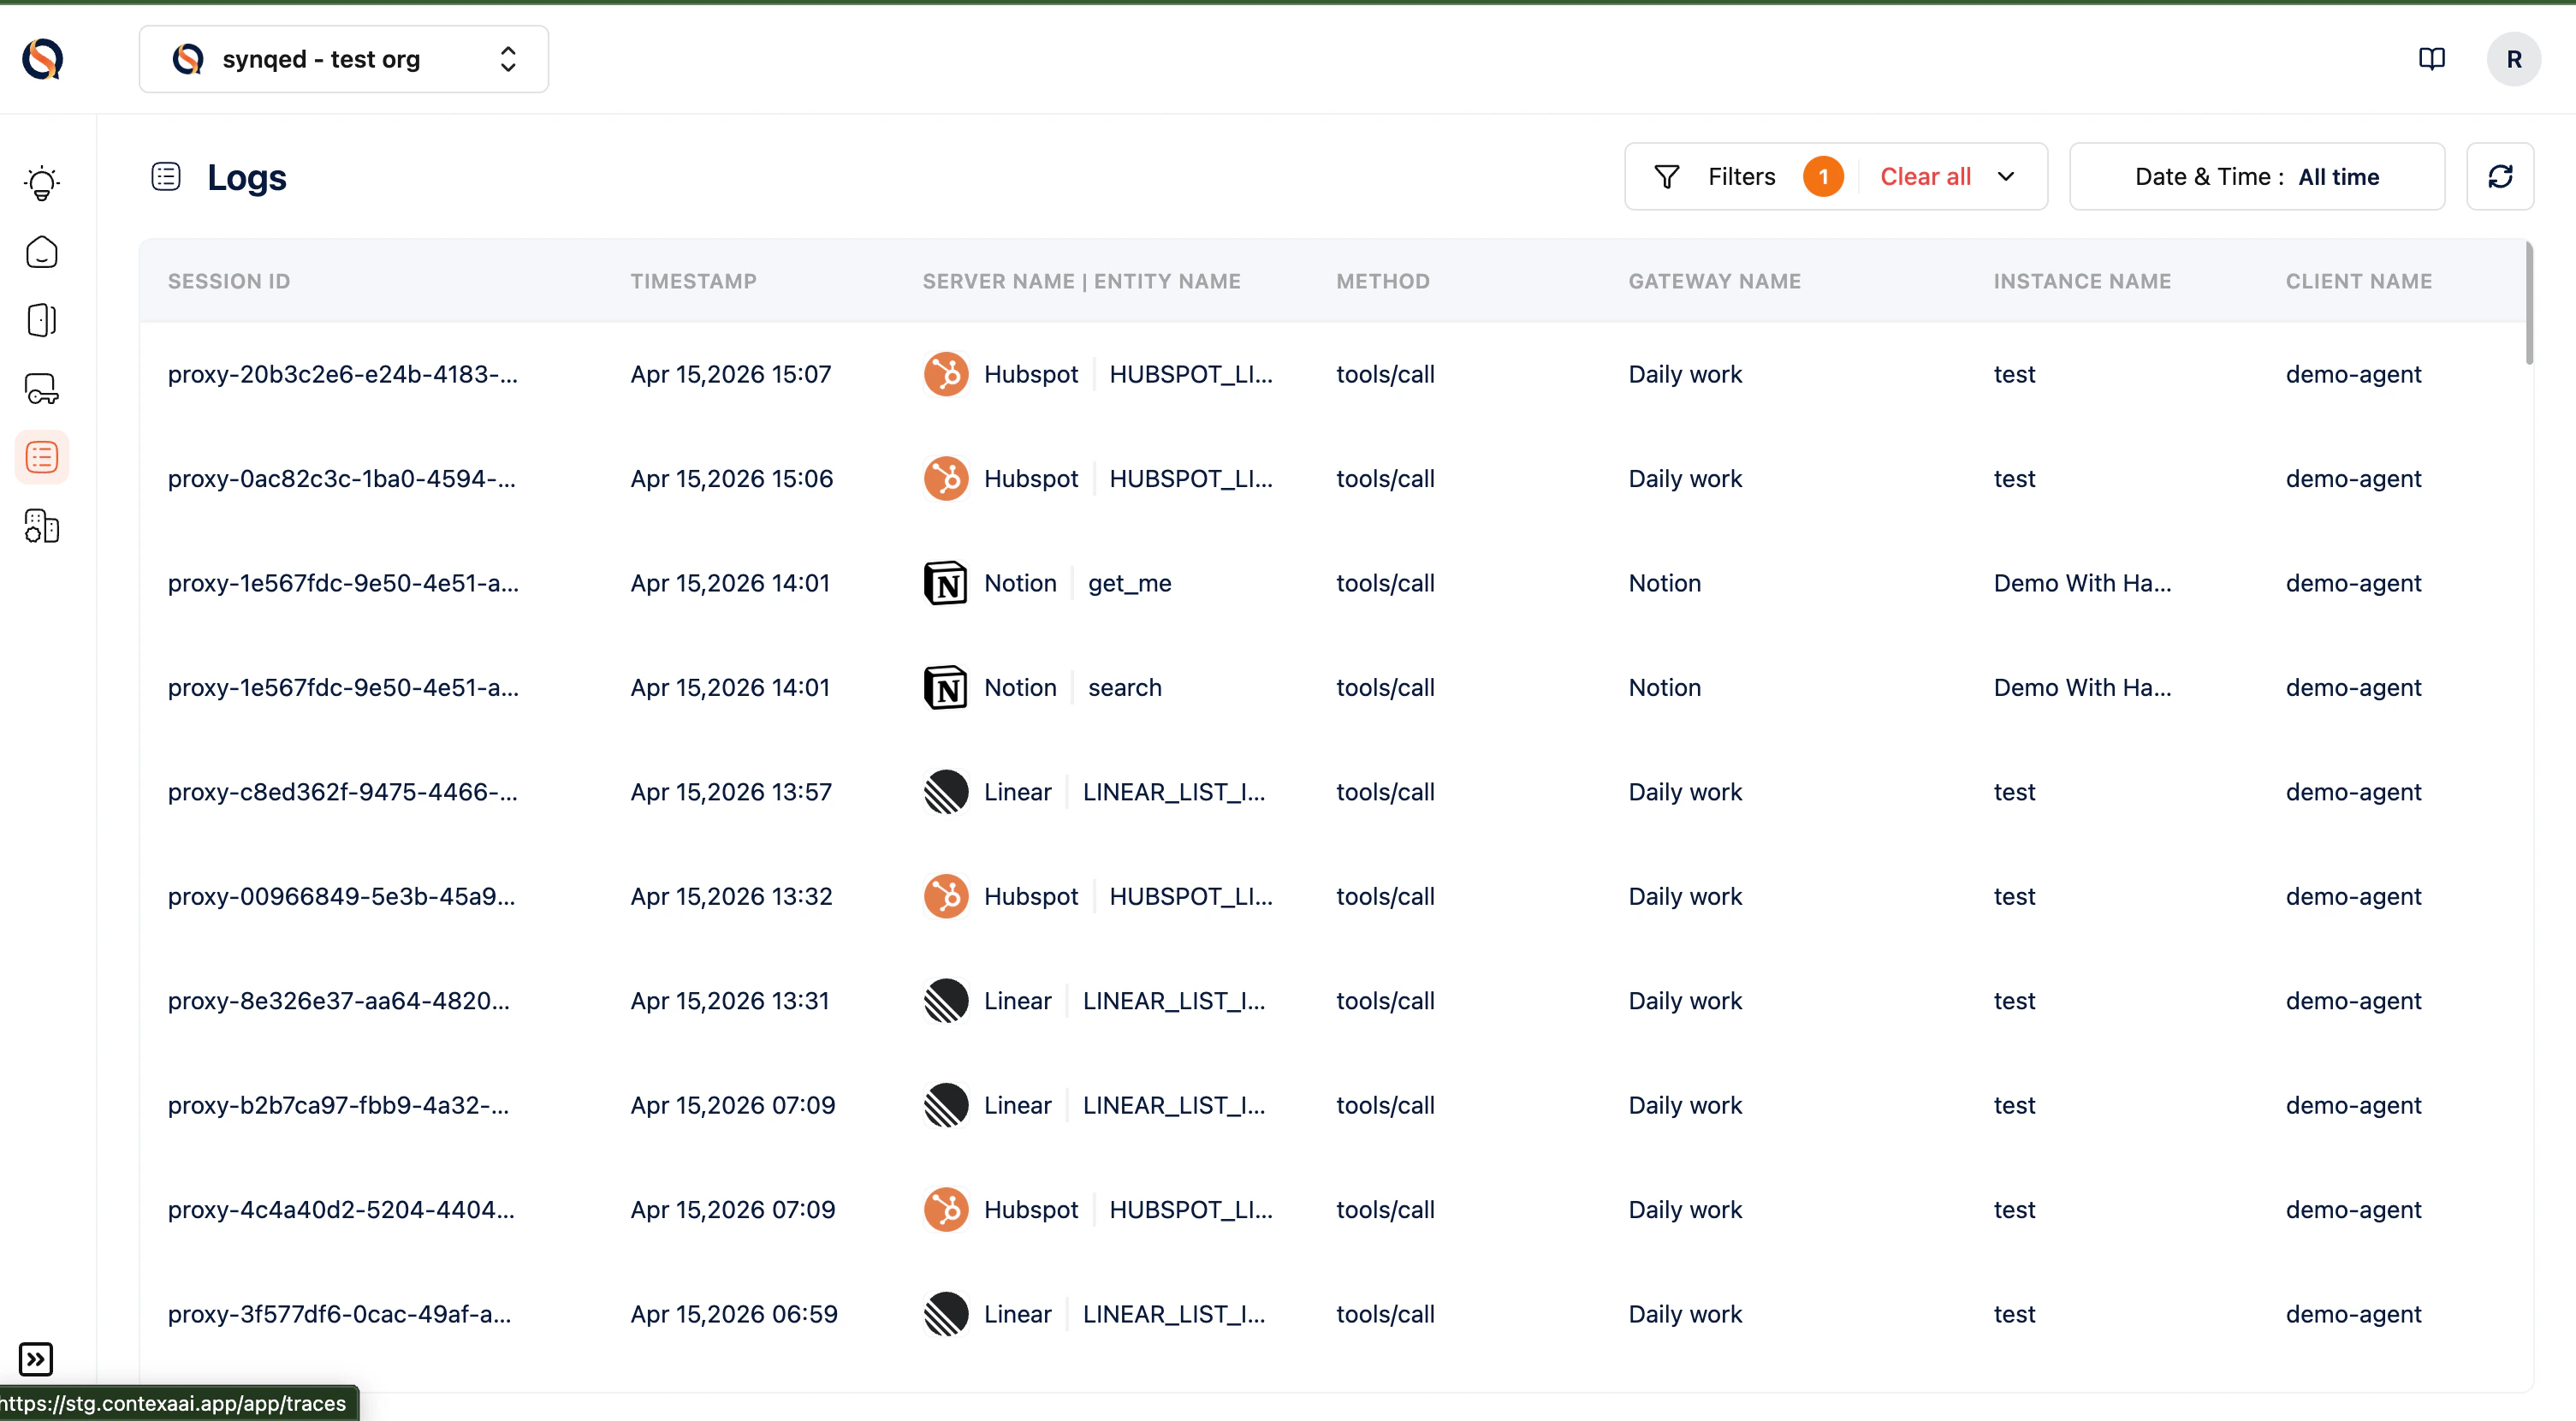
Filtering logs
The top bar gives you two main ways to narrow results:- Filters — a count badge shows how many filters are active; click to add filters on server, tool, gateway, instance, client, or session. Use Clear all to reset.
- Date & Time — defaults to All time; switch to a specific window (last hour, last 24 hours, custom range) to focus on recent activity.
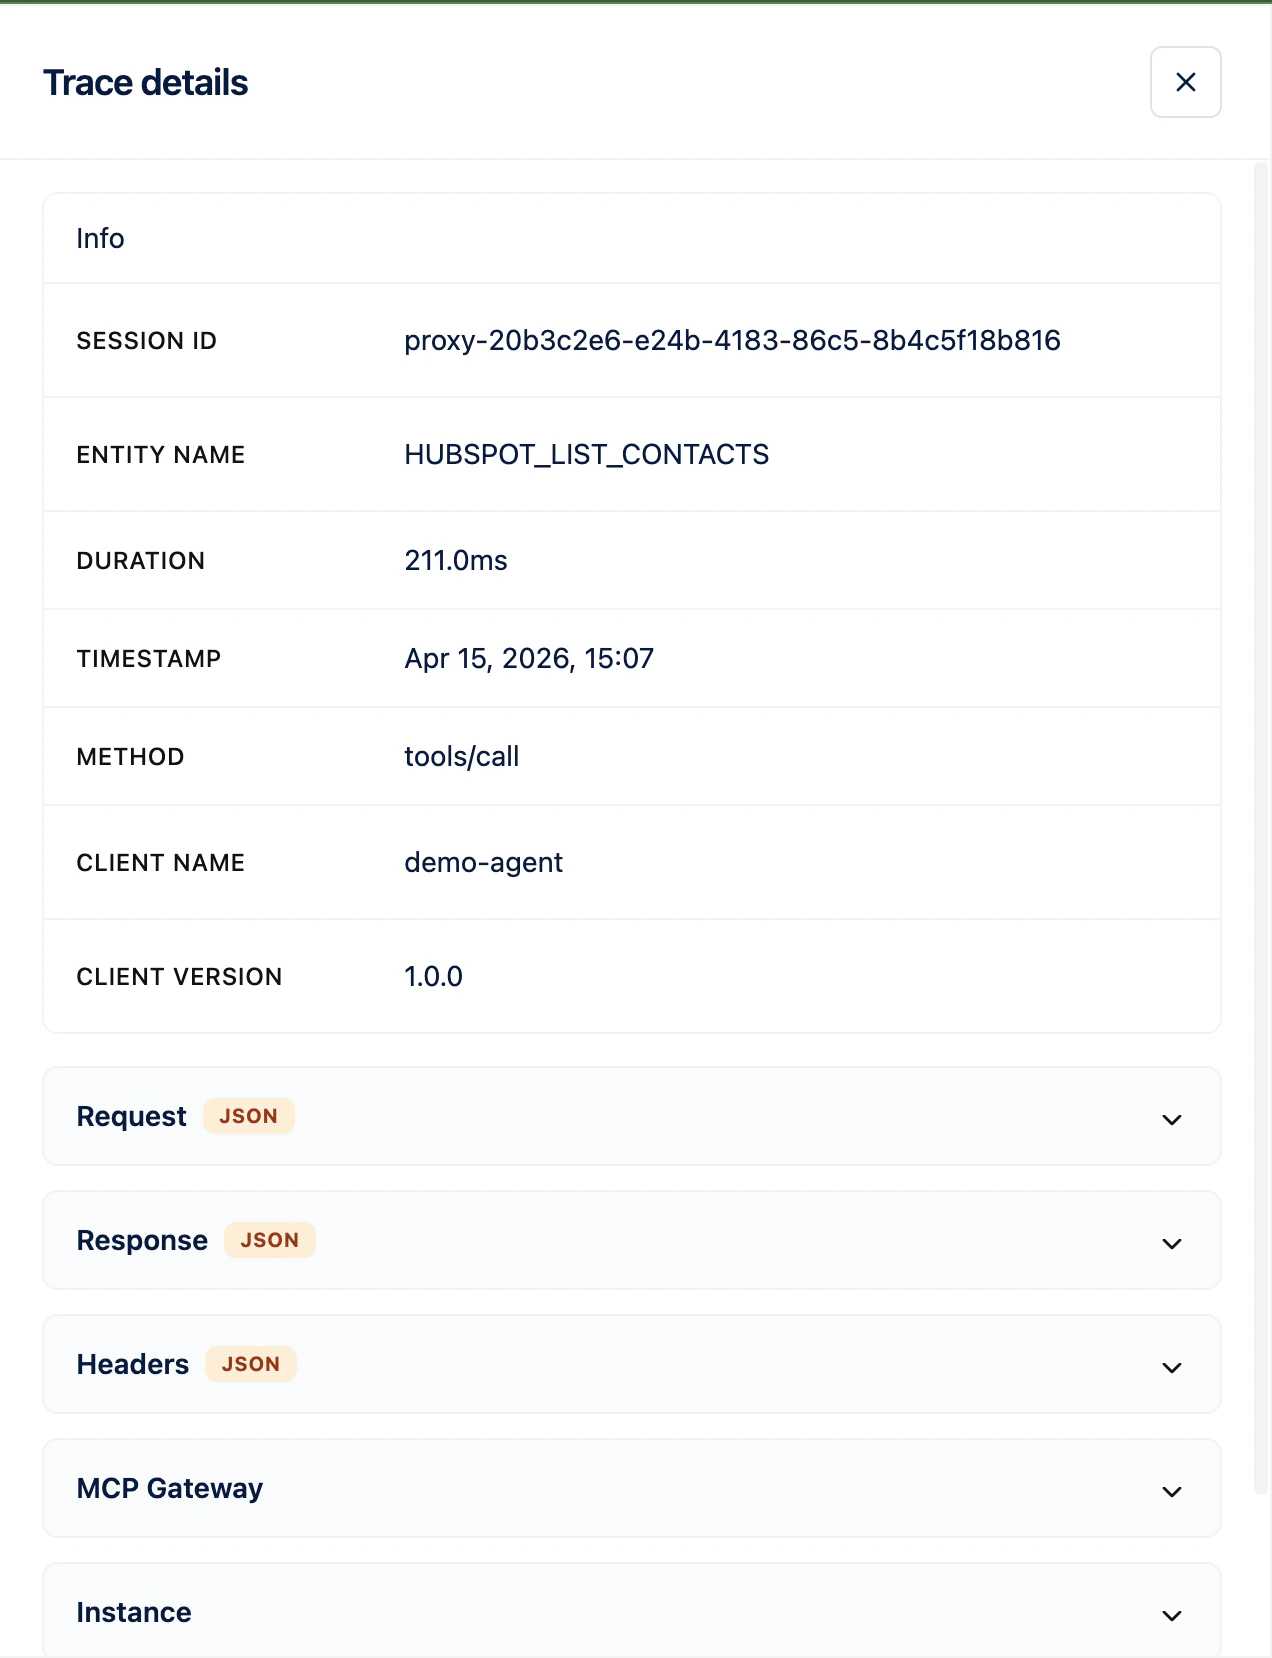
Opening a trace
Click any log row to open the Trace details panel on the right. Every trace starts with an Info block showing:- Session ID
- Entity Name (the tool invoked)
- Duration (e.g., 211.0 ms)
- Timestamp
- Method (e.g., tools/call)
- Client Name
- Client Version
- Request (JSON) — the exact input the MCP client sent
- Response (JSON) — what the gateway returned to the client
- Headers (JSON) — the MCP headers accompanying the call
- MCP Gateway — which Gateway Config handled the call
- Instance — which Instance served it
- User Details — the connected user context
Common use cases
- Debugging — when a client gets an unexpected result, open the trace and inspect the request/response JSON to pinpoint what went wrong.
- Auditing — produce a full history of which clients invoked which tools on which gateways, with millisecond-level timestamps.
- Performance tuning — scan durations across similar calls to identify slow tools or upstream APIs.
- Security review — filter by client or server to confirm that activity matches expectations.